Cluster Overview
The cluster overview page provides a single-page summary of a Kubernetes cluster's health and resource usage, including stat cards, resource charts, and recent events.
Cluster Overview
The cluster overview page provides a single-page summary of a Kubernetes cluster's health and resource usage, including stat cards, resource charts, and recent events.
Top Stats Cards
The top of the page displays four stat cards in a row:
- Cluster Health — Shows the current cluster status (Running, Creating, Failed, or Unknown) along with the number of Ready and NotReady nodes.
- Total Pods — Shows the total number of pods and how many are in the Running state.
- Total Nodes — Shows the total node count, broken down by control-plane and worker nodes.
- Autoscaling — Indicates whether autoscaling is enabled. When enabled, displays the current worker count and the maximum node limit. When disabled, shows "Manual scaling."

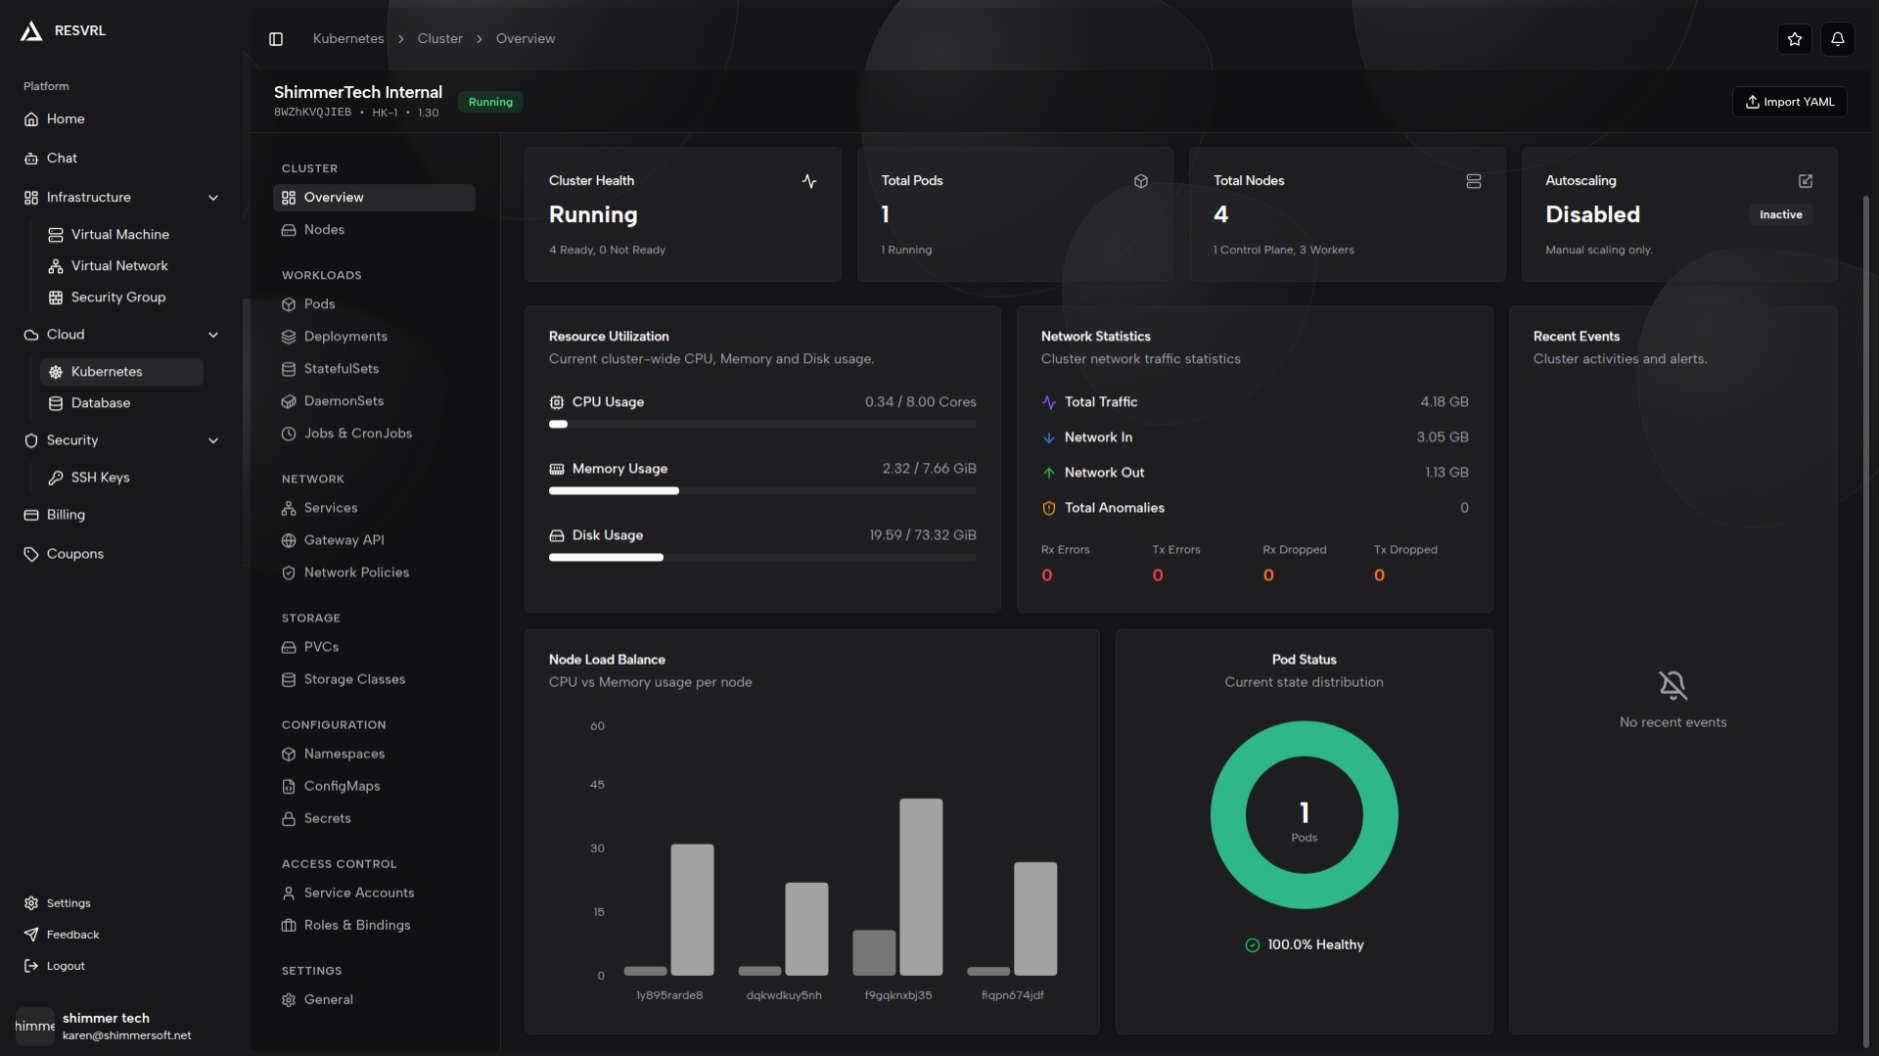
Resource Utilization
Displays CPU (cores), Memory (GiB), and Disk (GiB) usage as progress bars. Each resource shows the exact values (e.g., 2.50 / 8.00 cores) alongside a usage-percentage bar.
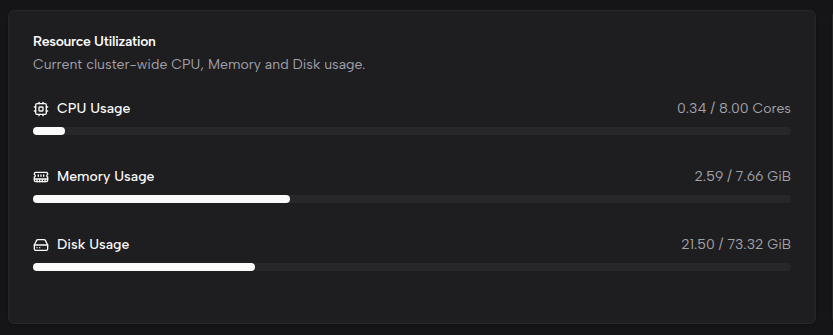
Network Statistics
Shows cluster network traffic and anomalies, including:
- Total Traffic — Combined inbound and outbound traffic (auto-formatted as B/KB/MB/GB/TB).
- Network In (Rx) — Total received bytes.
- Network Out (Tx) — Total transmitted bytes.
- Total Anomalies — Sum of all error and dropped packet counts.
Anomaly details are displayed in a four-column grid with color coding:
- Rx Errors — red
- Tx Errors — red
- Rx Dropped — orange
- Tx Dropped — orange
If error or dropped counts continue to increase, check the cluster network configuration and host network status.
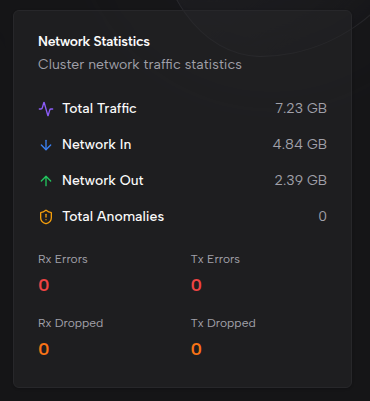
Node Load Balance
A grouped bar chart showing per-node CPU and memory usage percentages. Each node has two bars representing CPU and memory usage respectively, making it easy to identify nodes under resource pressure.
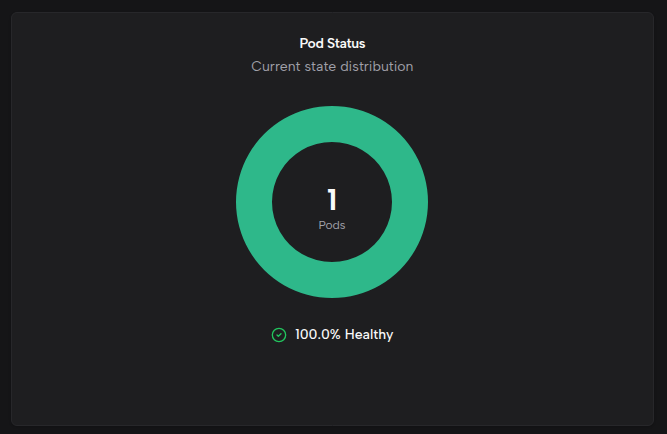
Pod Status
A donut chart showing the distribution of pods by status:
- Running — Active pods
- Pending — Pods awaiting scheduling
- Failed — Pods that have failed
- Unknown — Pods with unknown status
The center of the chart displays the total pod count, and the footer shows the healthy percentage (Running pods as a proportion of total pods).
Pending pods may be caused by resource shortages or scheduling constraints — review node resources and workload specifications. Failed pods require inspecting events and logs to determine the root cause.
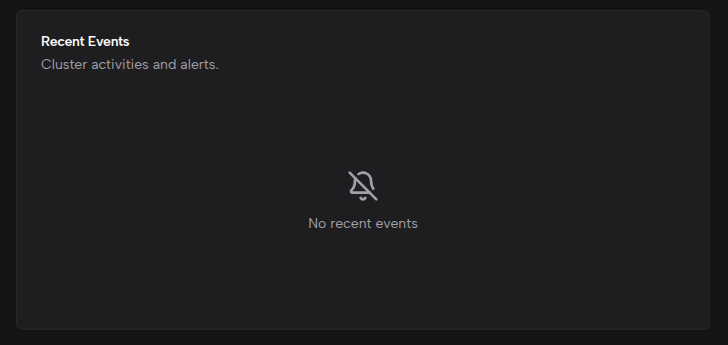
Recent Events
Lists recent cluster events with color-coded dots: Warning (yellow) and Normal (blue). Each event includes the message, timestamp, reason, and source component. The list shows up to 8 events.
When no events are present, an empty state message is displayed. For historical events, use kubectl or equivalent command-line tools.
Important Notes
- Resource utilization (CPU, memory, disk) and node load charts depend on metrics-server. If metrics-server is not installed, values show as N/A and the node load chart displays a "metrics unavailable" message.
- Newly created clusters may take a few minutes to collect complete metric data.
- Page data auto-refreshes: every 5 seconds when the cluster is in Creating or Deleting state, and every 30 seconds during normal operation.
Related Docs
This document was updated on 2026-04-25 09:00